
Opening your sleep app can feel a bit like stepping into mission control. There’s a score, a graph, colorful bars, percentages, maybe even a recovery metric quietly judging your life choices from the corner of the screen.
If you’ve ever thought, “Okay… but what am I actually supposed to do with this?” you’re not alone.
Understanding how to read sleep tracker data isn’t about obsessing over every number. It’s about learning what each metric is really telling you, what’s reliable, what’s more of an estimate, and how to zoom out enough to see the bigger picture.
Modern sleep tracker technology is incredibly good at spotting patterns, but the real magic happens when you know how to interpret those patterns without overthinking them.
Think of this as learning how to read a weather map for your sleep. Once you understand the symbols, everything suddenly makes a lot more sense.
Sleep Tracker Data Explained: Table of Contents
How To Read Your Sleep Score
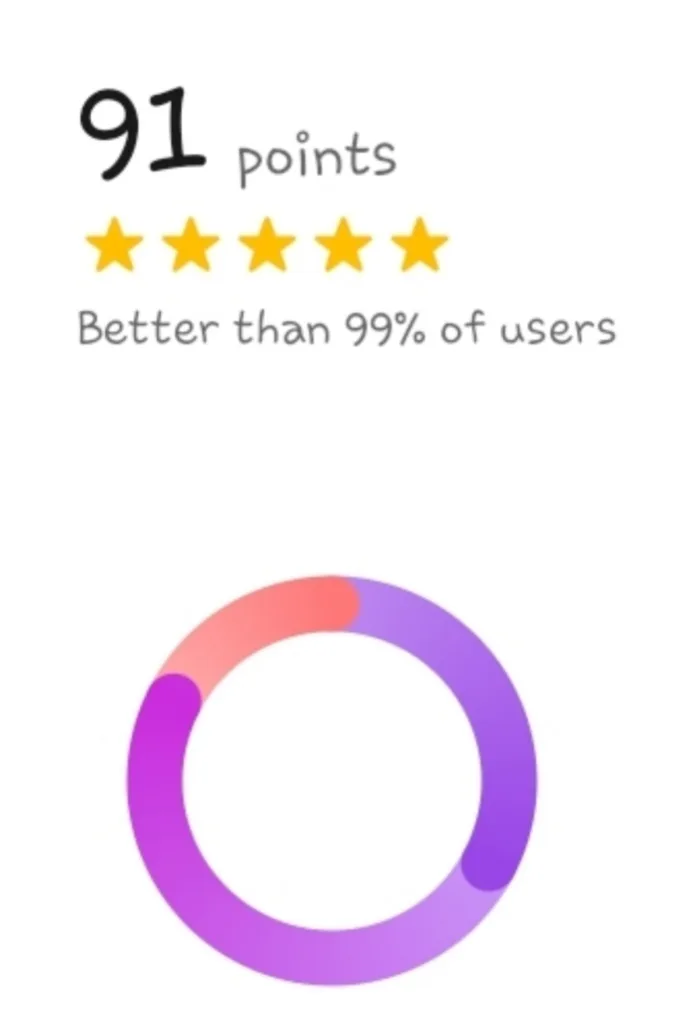
Your sleep score is the headline act — the big number designed to answer the question, “How did I sleep?” in one glance.
Most devices calculate this score using a combination of factors like total sleep time, restlessness, sleep stages, and sometimes heart rate patterns. It’s essentially a summary of multiple signals rolled into a single metric meant to be easy to understand.
But here’s the important part: it’s a summary, not a verdict.
A higher score generally means you slept long enough with relatively few interruptions. A lower score usually reflects shorter sleep, more restlessness, or irregular timing.
But because it compresses so many variables into one number, it’s best used as a trend indicator rather than something to obsess over night to night.
Think of it like a movie rating. It’s helpful for a quick impression, but not the full story.
In other words, sleep scores are useful for spotting patterns over time, but they shouldn’t be treated as a precise measurement of sleep quality on any single night.
How To Read Total Sleep Time
If sleep data had a “most reliable friend,” total sleep time would be it.
Across the best sleep trackers, this metric tends to be one of the most consistent because it relies heavily on movement and physiological changes that are easier for sensors to detect.
While devices can sometimes overestimate sleep if you’re lying still but awake, the overall duration is usually directionally accurate.
Instead of focusing on hitting a specific number every night, look at patterns:
- Are you consistently getting roughly the same amount of sleep?
- Are there big swings between weekdays and weekends?
Stability matters more than perfection here.
For most people trying to understand sleep tracker metrics, duration is the single most important signal to watch first.
How To Understand Sleep Stages
Sleep stages are where things start to get a little confusing.
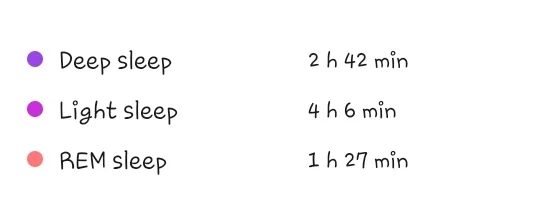
Most trackers divide sleep into light, deep, and REM sleep.
Each stage represents distinct physiological processes that occur overnight, from physical restoration to memory consolidation and emotional processing.
Light sleep usually makes up the largest portion of your night and acts as the transition between stages.
Deep sleep is associated with physical recovery, while rapid eye movement (REM) is linked to dreaming and cognitive processing.
But here’s the nuance: trackers aren’t measuring brain waves directly, so these stages are estimates based on patterns in heart rate variability and movement.
That means nightly percentages will naturally fluctuate and shouldn’t be interpreted too literally.
It’s more helpful to look at general patterns over time rather than worrying about whether you got exactly the “right” amount on any given night.
How To Read Your Sleep Graph
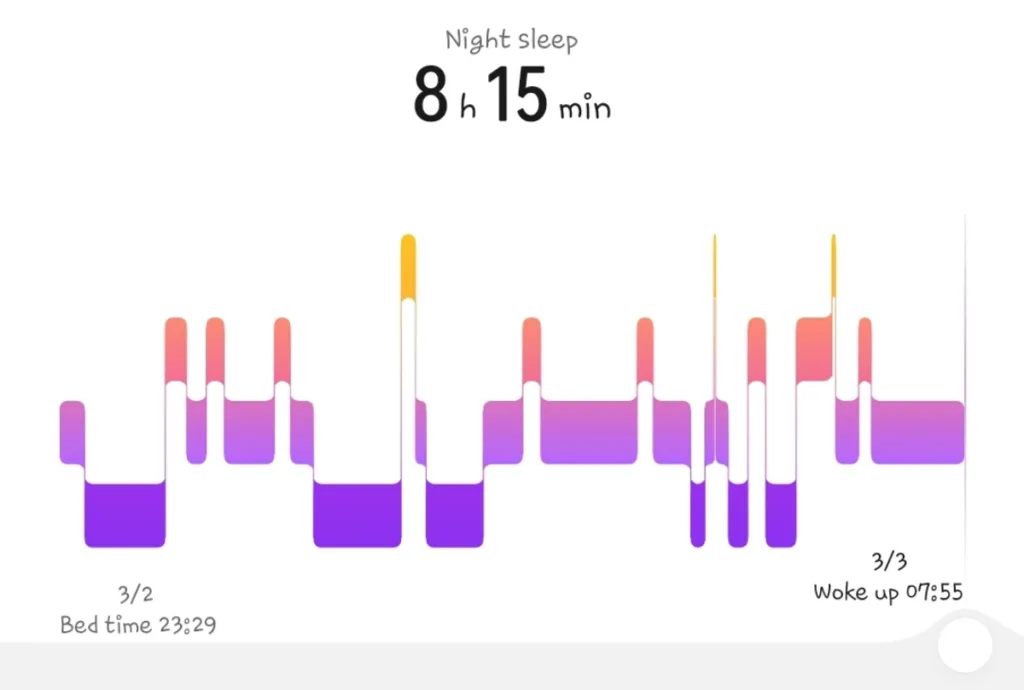
If the sleep score is the headline, the sleep graph is the full story.
This timeline shows when you were asleep, restless, or awake throughout the night. Spikes or interruptions often represent movement or brief awakenings, while smoother sections suggest more stable sleep.
What makes the graph powerful is that it reveals patterns you might not notice otherwise.
Maybe you consistently wake around the same time each night. Maybe your sleep is fragmented early but stabilizes later. Maybe weekends look completely different from weekdays.
Over time, the graph helps you see whether your sleep is becoming more consolidated or more disrupted.
The graph is actually one of the most useful tools because it shows patterns visually rather than reducing sleep to a single score.
How To Interpret Restfulness And Wake-Ups
One of the sneakiest things sleep trackers reveal is how often you’re actually waking up during the night, even if you don’t remember it.
Restfulness metrics look at movement and brief awakenings to estimate how disrupted your sleep was. A night with lots of tossing, turning, or small awakenings might still look long on paper but feel less restorative.
The key thing to remember is that waking up briefly is completely normal.
Most people wake multiple times per night — the difference is whether those awakenings are short and subtle or long enough to fragment sleep.
If you notice frequent restlessness, it can sometimes point toward things like stress, room temperature, noise, or inconsistent routines. But occasional restless nights are just part of being human, not a problem to fix.
Think of restfulness as a measure of how smooth your night felt from your body’s perspective.
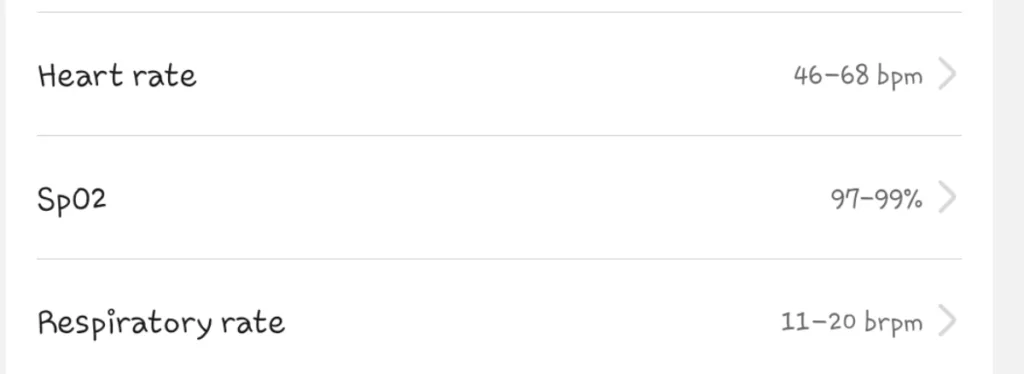
How To Read Heart Rate And Recovery Signals
If your tracker includes overnight heart rate or heart rate variability (HRV), you’re getting a glimpse into how your nervous system behaved while you slept.
Generally speaking, a lower overnight heart rate suggests your body was relaxed and recovering, while a higher-than-usual rate can reflect stress, illness, late meals, alcohol, or intense exercise.
HRV is often interpreted as a recovery signal. Higher HRV tends to indicate greater adaptability and recovery, while lower HRV can reflect stress or fatigue.
The keyword here is trends. Single-night readings don’t tell the full story. These signals are less about judging your sleep and more about understanding how your body responds to life.
Over time, these signals can help explain why sleep might feel different from night to night, even when sleep duration looks similar.
How To Tell What Sleep Tracker Data Actually Matters
One of the biggest mistakes people make when learning how to interpret sleep data is assuming every metric deserves equal attention.
If you try to focus on everything at once, it quickly becomes overwhelming, but if you know which signals matter most, the story becomes much clearer.
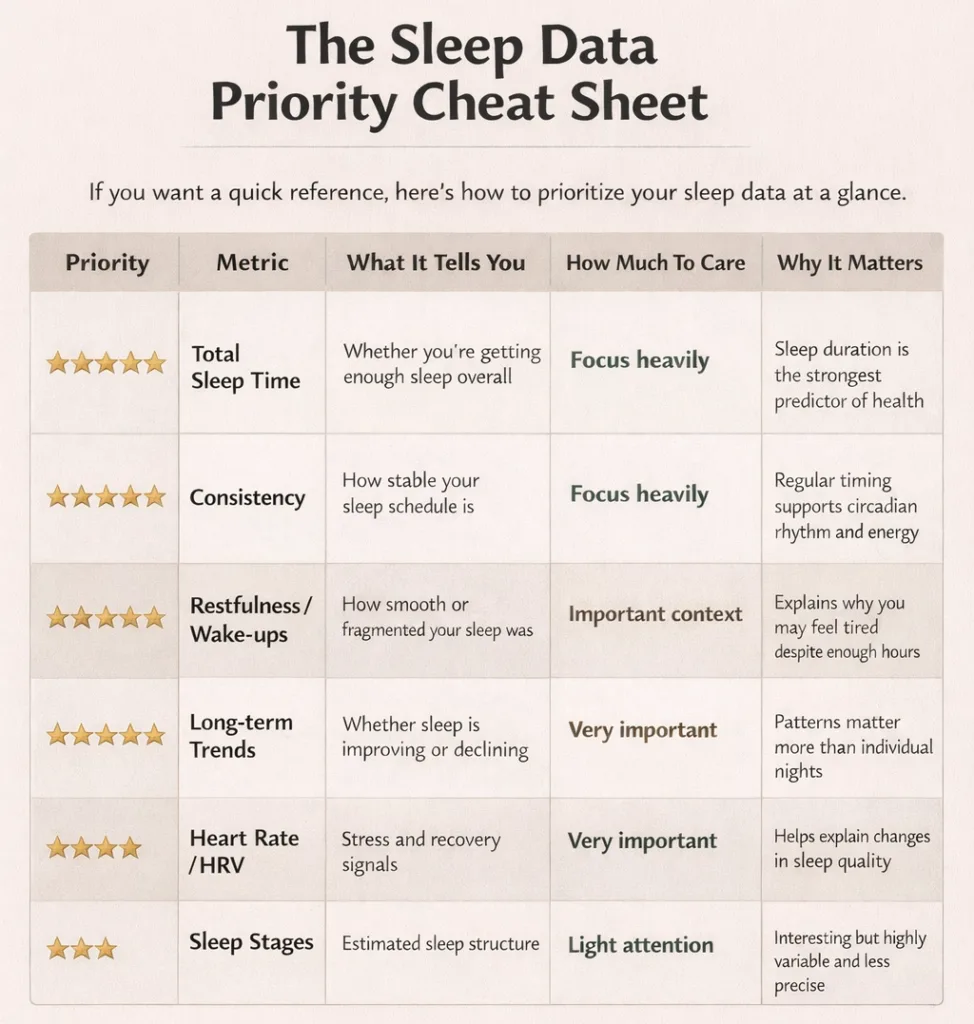
Start With Duration: Your Sleep Foundation
Sleep duration is one of the most reliable signals across devices and one of the strongest predictors of overall sleep health. It sets the baseline for everything else. Without enough sleep time, even “perfect” stages or scores don’t mean much.
When reviewing your data, ask:
- Are you consistently getting enough sleep for your needs?
- Is your sleep duration stable across nights?
- Do you see patterns of sleep debt during the week?
Consistency in duration is often more important than occasional long nights.
Next Look At Consistency: The Rhythm Signal
Sleep is deeply tied to circadian rhythms, which means regular timing matters just as much as quantity.
Look at your sleep and wake times across the week.
Large swings — especially between weekdays and weekends — can create what’s sometimes called social jet lag, which affects energy, mood, and recovery.
Stable timing is one of the clearest signs of healthy sleep patterns, and trackers are very good at highlighting irregularity.
Then Look At Restfulness: The Quality Context
Once duration and consistency look stable, restfulness helps explain how smooth your sleep actually was.
Frequent awakenings, long restless periods, or fragmented sleep can explain why you might feel tired even after enough hours in bed. Occasional disruptions are normal, but persistent fragmentation is worth noticing.
Think of restfulness as the difference between sleeping long and sleeping well.
Use Heart Rate Trends As A Stress Signal
Overnight heart rate and HRV provide insight into how your body is responding to stress, illness, recovery, or lifestyle changes.
Rather than focusing on single nights, look for patterns:
- Is your overnight heart rate trending higher than usual?
- Does HRV drop during stressful periods?
- Do recovery signals improve after rest days?
These metrics help explain why sleep might feel different, not just how long it lasted.
Treat Sleep Stages As Supporting Characters
Sleep stages are fascinating, but they’re also the most variable and least precise metric in consumer tracking.
They’re useful for understanding general patterns, like whether you’re consistently getting some deep and REM sleep, but nightly fluctuations are normal and often meaningless.
Instead of asking, “Did I get enough deep sleep last night?” it’s more helpful to ask, “Are my stage patterns generally stable over time?”
Stages provide context, not conclusions.
Know What To Ignore
Some metrics are simply more sensitive to noise.
Small nightly changes in sleep stages, minor score fluctuations, or slight variations in heart rate are often normal and don’t require action. Over-focusing on these can create unnecessary worry without improving sleep.
In some cases, people become so focused on optimizing sleep tracker numbers that it actually increases anxiety around sleep — a phenomenon researchers sometimes call orthosomnia. Sleep data should guide awareness, not create pressure.
Why Device Type Changes The Picture
Differences between wearables and non-wearables also shape what data is most meaningful.
Wearables capture more physiological signals like heart rate and HRV, making recovery metrics more informative. Non-wearable devices rely more on movement and breathing patterns, which makes duration and timing the strongest signals.
Understanding how your device gathers data helps you interpret metrics more realistically.
The Sleep Data Priority Cheat Sheet
Frequently Asked Questions
What does a sleep score mean on a sleep tracker?
A sleep score is a summary rating that estimates how well you slept based on several factors, usually including total sleep time, restlessness, sleep stages, and heart rate patterns.
Which sleep tracker metric matters most?
Total sleep time, followed closely by sleep consistency. Getting enough hours of sleep on a regular schedule has the strongest impact on energy, recovery, and overall health. Other metrics like sleep stages or sleep scores provide context, but duration and timing form the foundation of healthy sleep.
Why does my sleep tracker data change every night?
Sleep tracker data changes nightly because sleep itself naturally varies. Stress, physical activity, illness, alcohol, late meals, and environmental factors like temperature or noise can all influence sleep patterns. What matters most is the long-term pattern across multiple nights.
How often should you check your sleep tracker data?
It’s best to review sleep tracker data weekly rather than obsessing over nightly results. Looking at trends across several nights helps reveal patterns in sleep duration, consistency, and restfulness.
What is considered a good sleep score?
A good sleep score typically indicates that you slept long enough with relatively few interruptions. Most trackers label scores above roughly 80–85 as good, though exact ranges vary by device.
How to Read Sleep Tracker Data: The Conclusion
Once you know how to interpret sleep tracking data, the numbers stop feeling like a confusing stream of data and start becoming useful signals about how your habits and environment shape your sleep.
When you focus on trends instead of nightly numbers, sleep data becomes far less confusing and far more useful.
If you’re serious about improving your sleep, we’ve got a few principles, and tips and tricks that can help. We also have a FREE sleep hygiene assessment to help you figure out where you might be going wrong.
Understanding your sleep data is the first step. Building better sleep habits is where the real improvement happens.
